
 POLYCITY
Powered by
What-ifs,
simulated at scale.
01 · ANY QUESTION
Ask anything
a city asks.
For example
02 · WHAT A SIMULATION IS
Your city,
living a normal day.
A simulation is a copy of your city where every resident lives a normal day. Each has a home, a job and a plan. Everyone travels at once, and their trips make the traffic. Stuck in a queue, a resident tries another route, hour or way next round, and keeps what works. Round after round, the city settles.
- The cityStreets, stops, timetables
- Its peopleA home, a job and a plan
- One dayTheir trips make the traffic
- Round after roundEach keeps what works
03 · TODAY’S CITY
Today’s city,
built and checked.
Built from open data, your own tables and your prices and settings, then checked against the real one. Every scenario starts from it.
04 · BASELINE AND SCENARIOS
Today against
the change.
A baseline is today's city, built from open data and checked. A scenario is a copy of it with changes.
05 · THREE KINDS
Three kinds of
simulation. One city.
Quick estimate
Which ideas are worth a full day?
- Follows
- Trips between zones
- Clock
- Hour by hour
- Results
- Congestion and Mobility
Simulated day
Does the plan work for everyone?
- Follows
- Every resident's day
- Clock
- A whole day, in rounds
- Results
- Every result
Junction study
Does this junction cope?
- Follows
- Every vehicle and its gap
- Clock
- Every second
- Results
- Junctions in detail
1Tartu mnt / Liivalaia83 m at 07:00
06 · AI FIRST
AI proposes
and estimates.
A simulated day
proves the plan.
AI turns a planner's goal into changes. A quick estimate scores each one fast with a low-resolution model. Only what holds up gets a simulated day, lived by every resident. The planner decides.
07 · OPTIMISATION
Thousands of tries.
The best one tested.
Buses and trams
Traffic lights
Sets how often each line runs, hour by hour, within a budget and a fleet.
Draws a new bus line where riders need one, within the money and buses set aside for it.
Moves when each line leaves, so a change between lines means less waiting.
Changes every line at once: new lines, new routes and how often each one runs.
Retimes every traffic light inside an area drawn on the map.
Times the lights along one street, so traffic meets green after green.


08 · RESULTS
Find the side effects
before your citizens do.
How people travel
What it does to the city
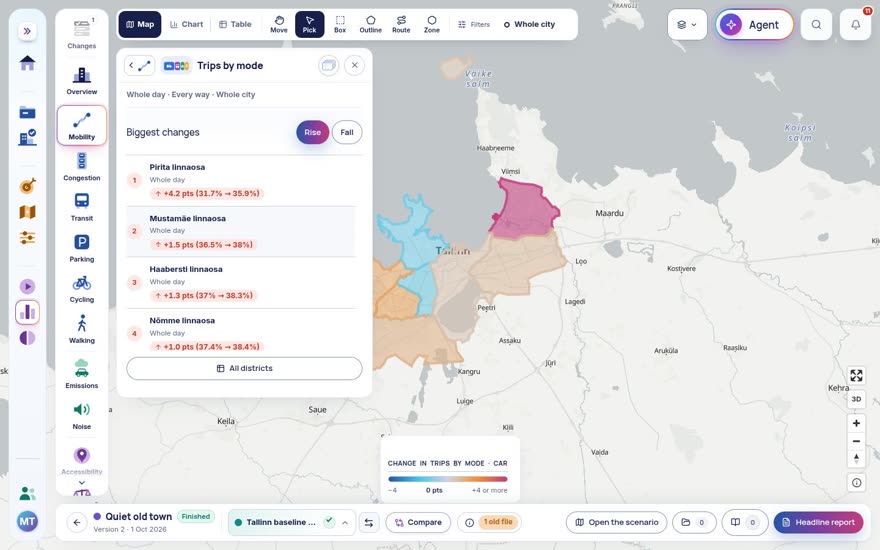
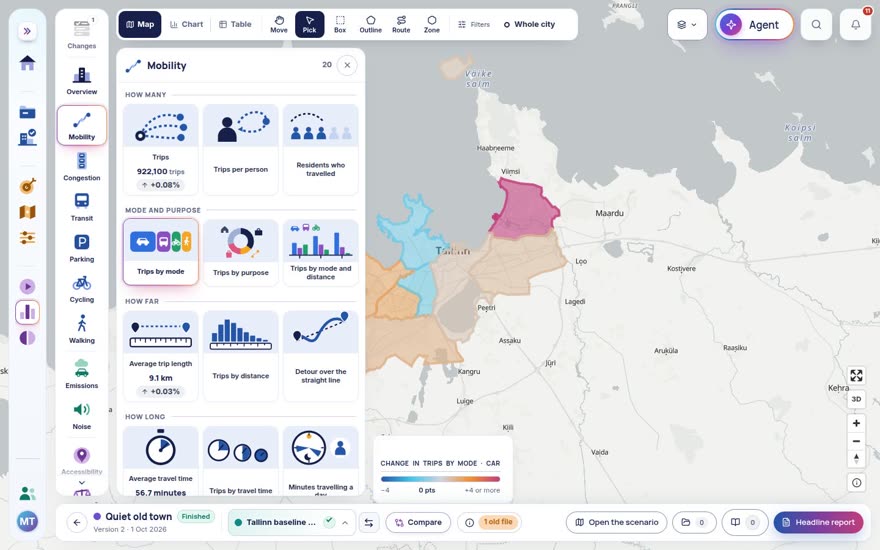
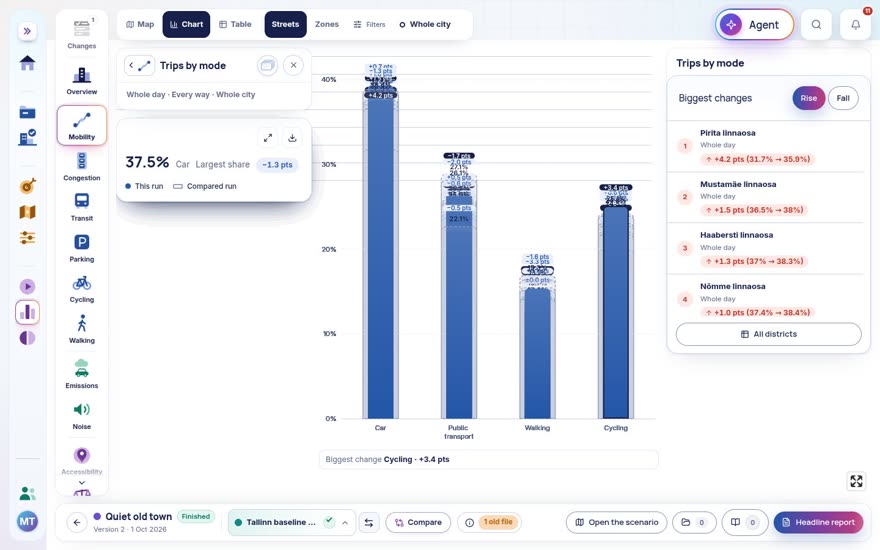
Compare trips by mode, average travel time and distance.
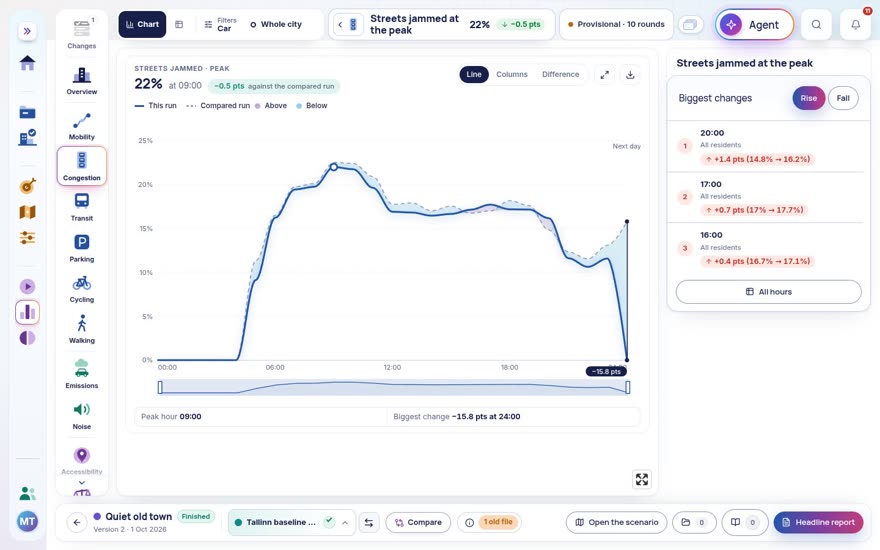
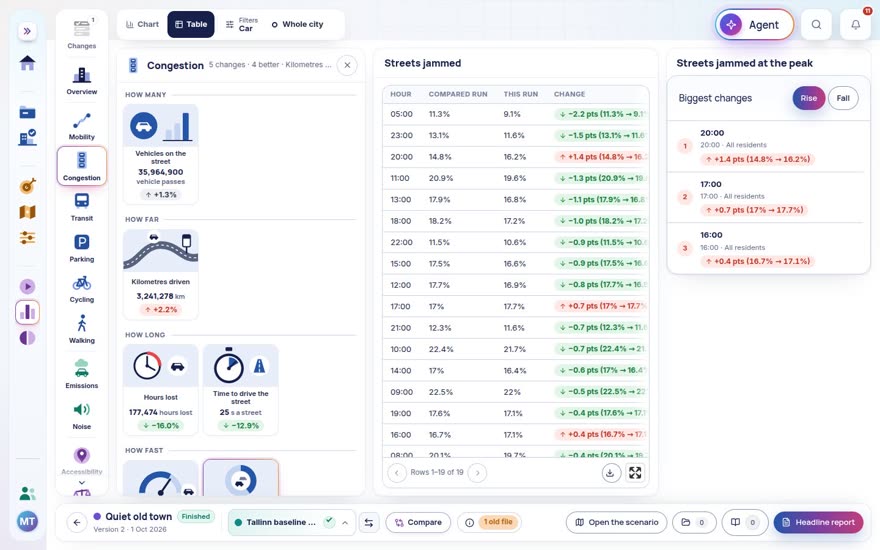
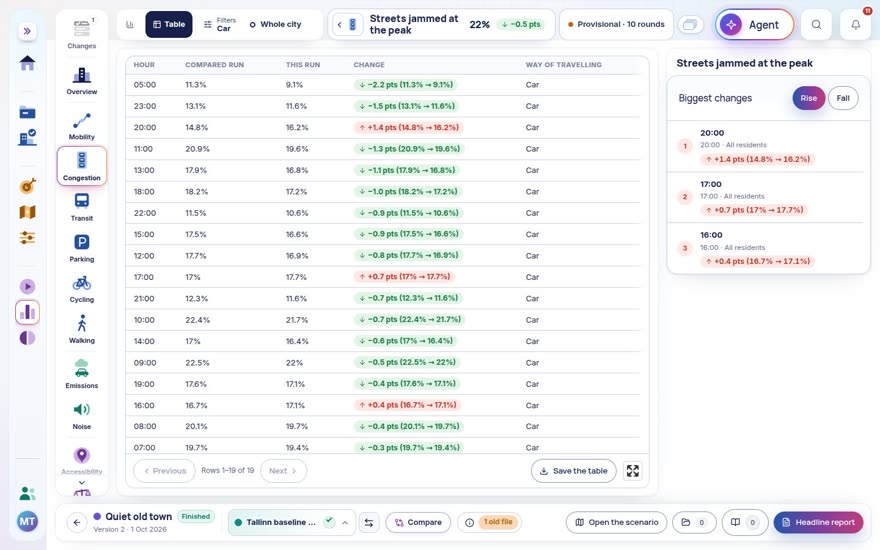
Find where traffic concentrates and how much time vehicles spend on the road.
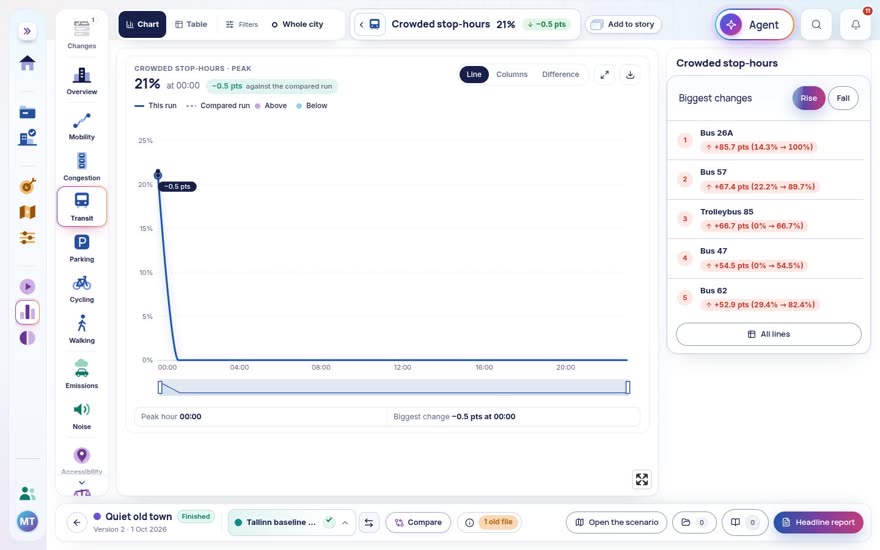
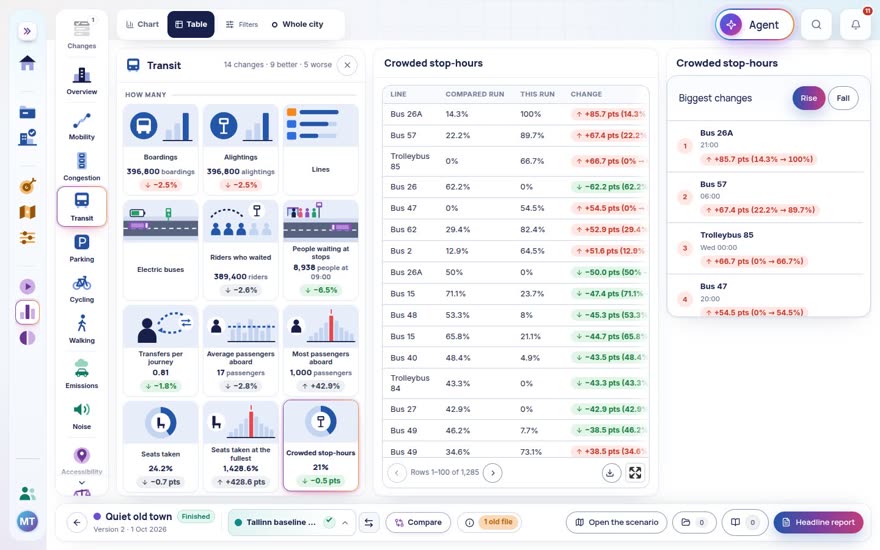
Compare boardings and how full each tram and bus runs across service alternatives.
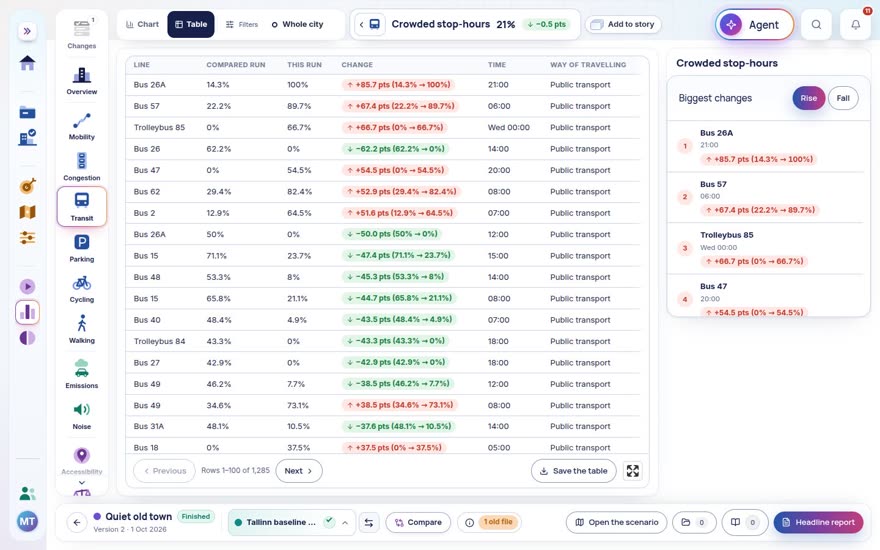
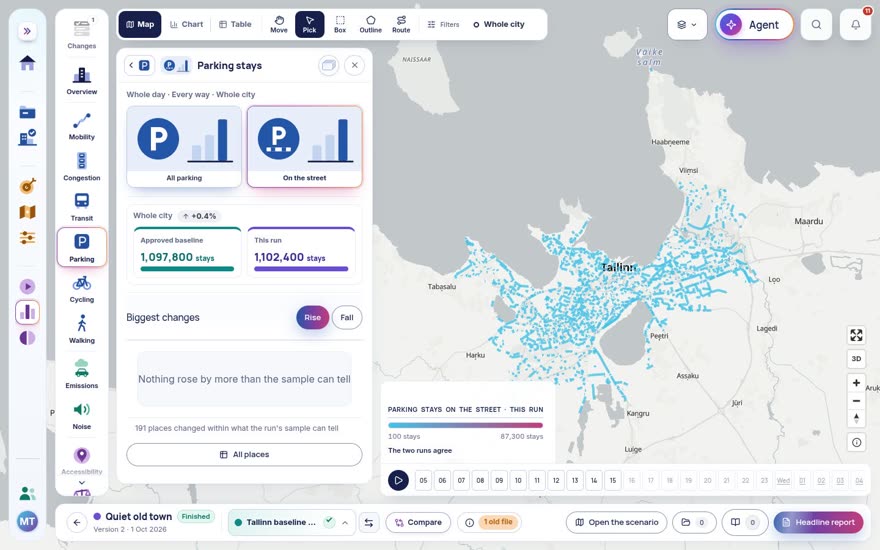
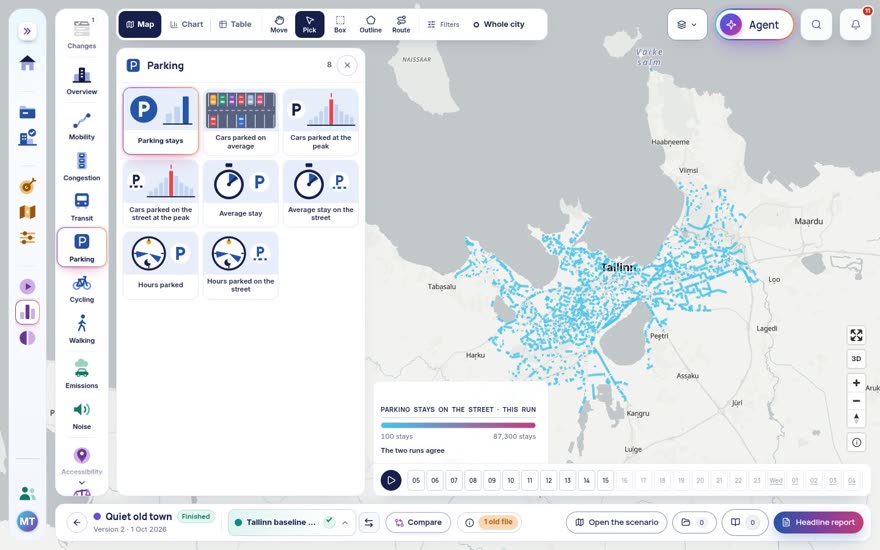
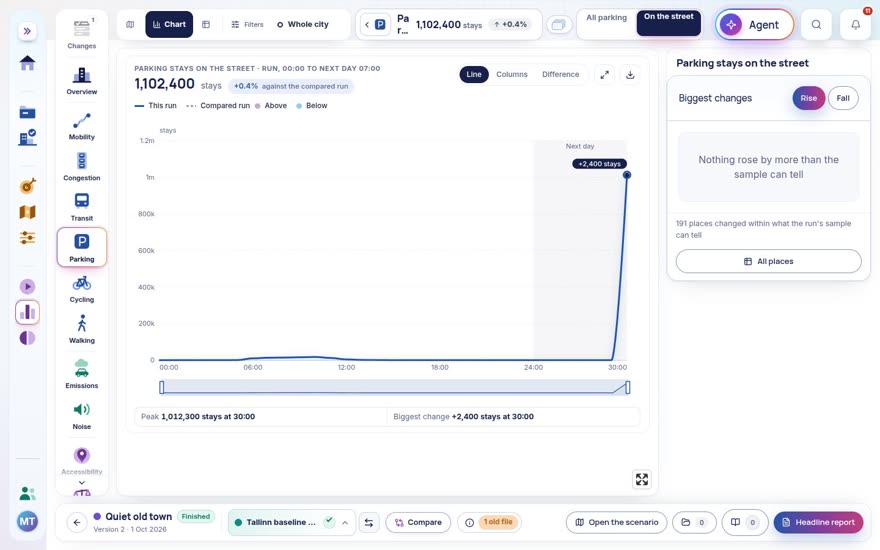
Understand parking occupancy, revenue and the time spent finding a space.
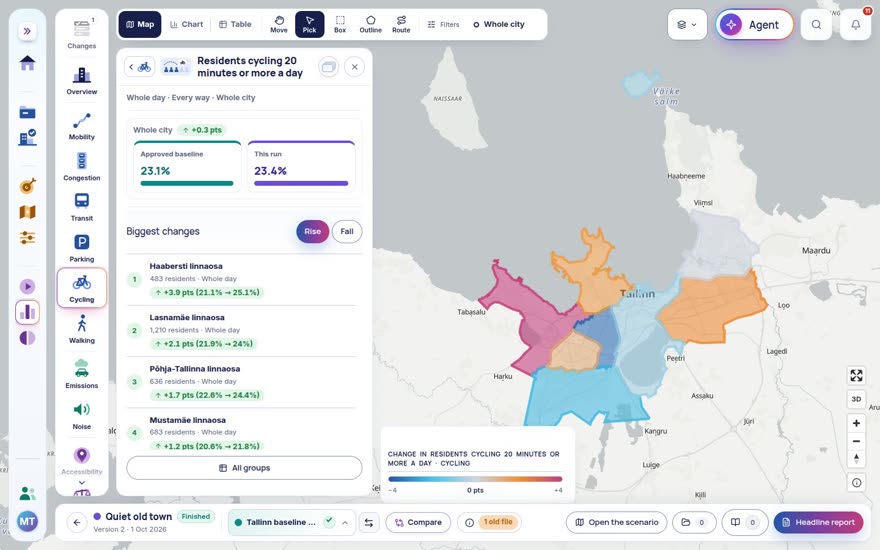
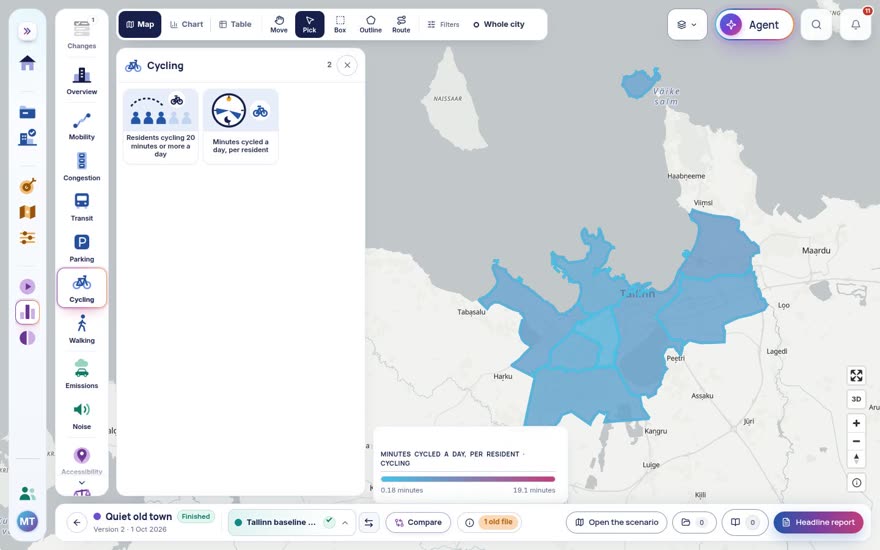
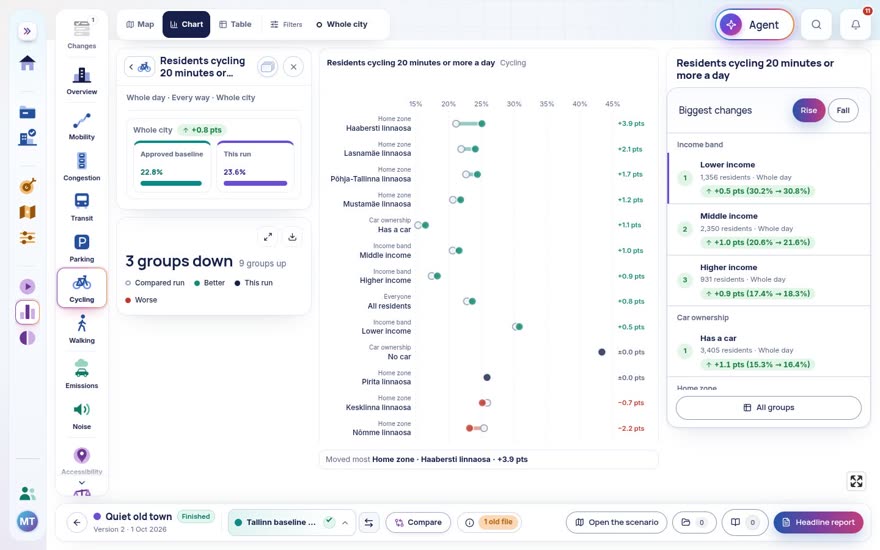
See where people ride, how fast, and how many hills they climb.
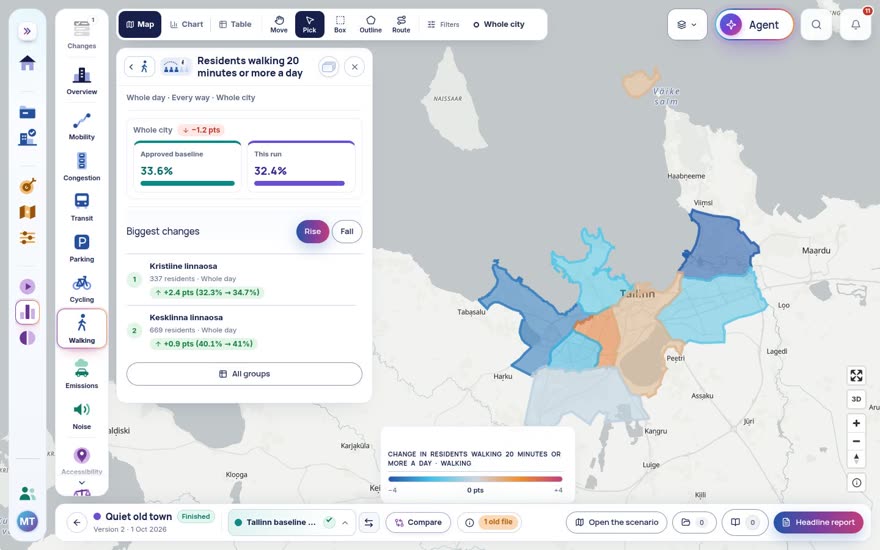
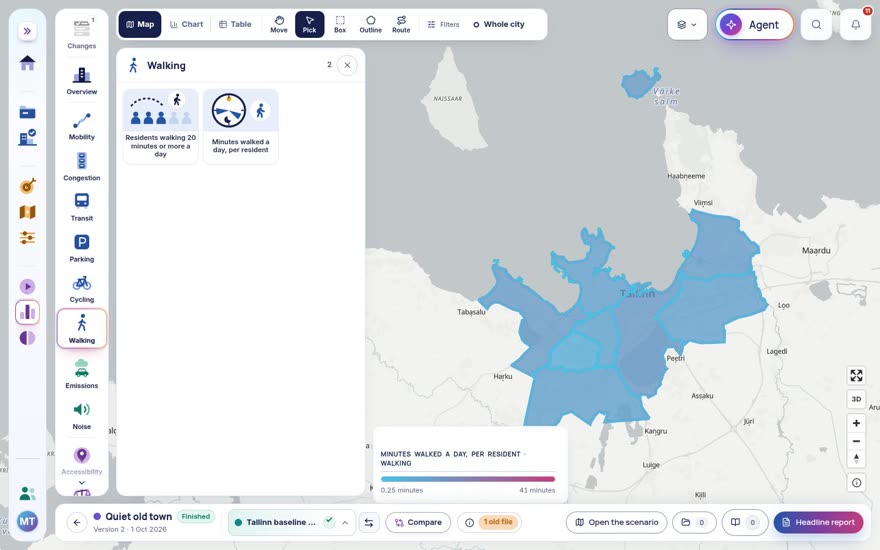
See where people walk, and how far.
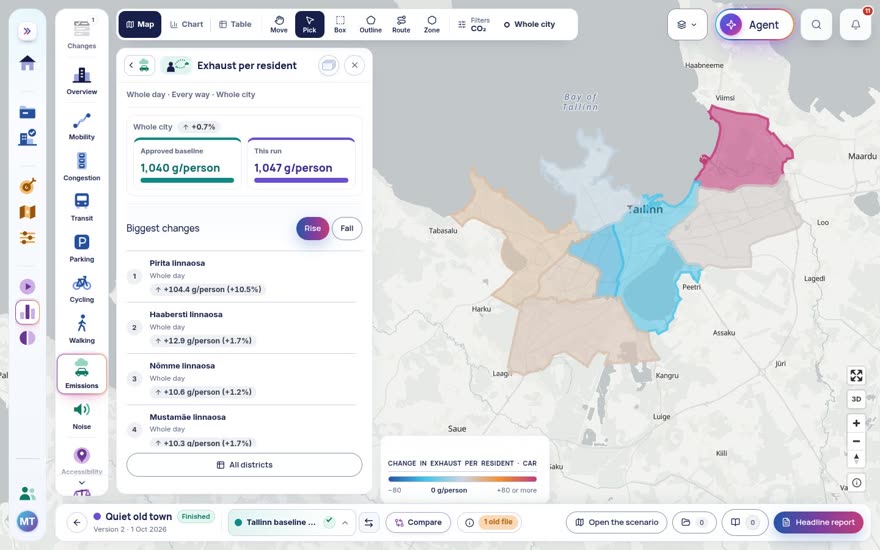
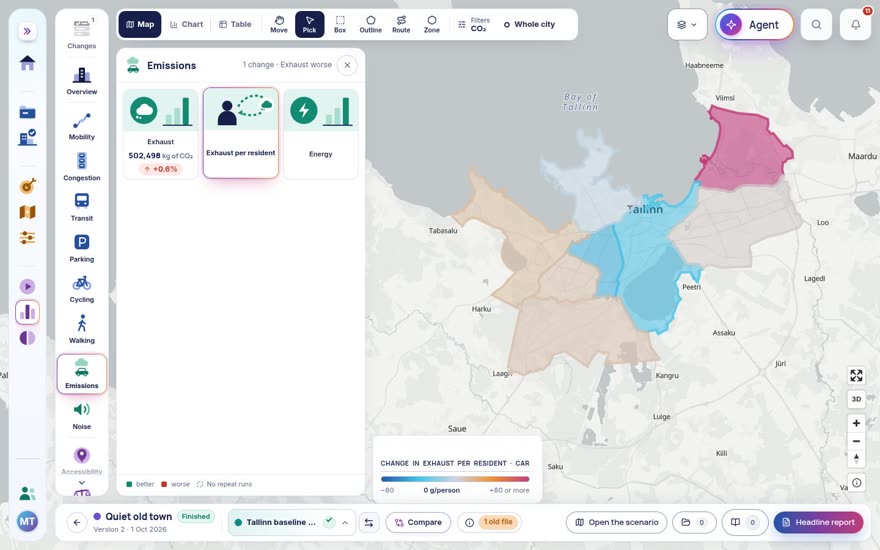
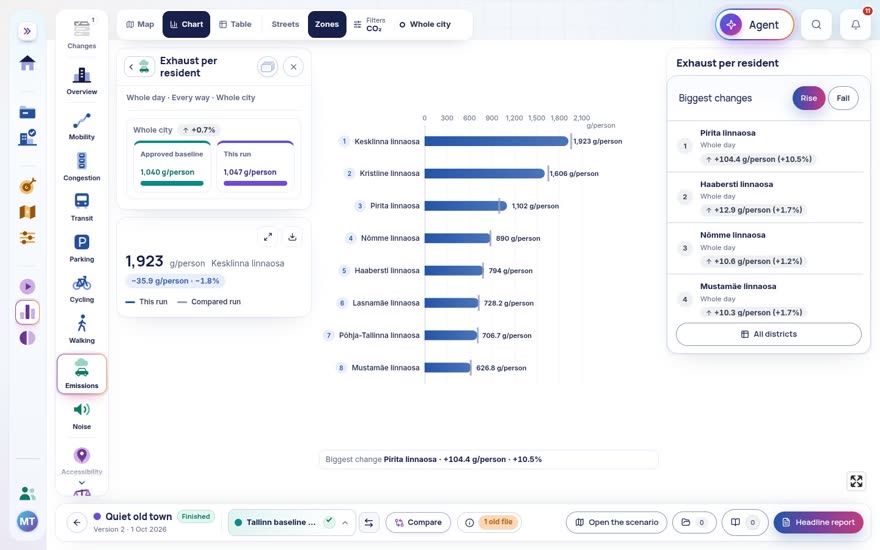
Examine emissions from simulated journeys. Compare how transport choices change the modelled outcome.
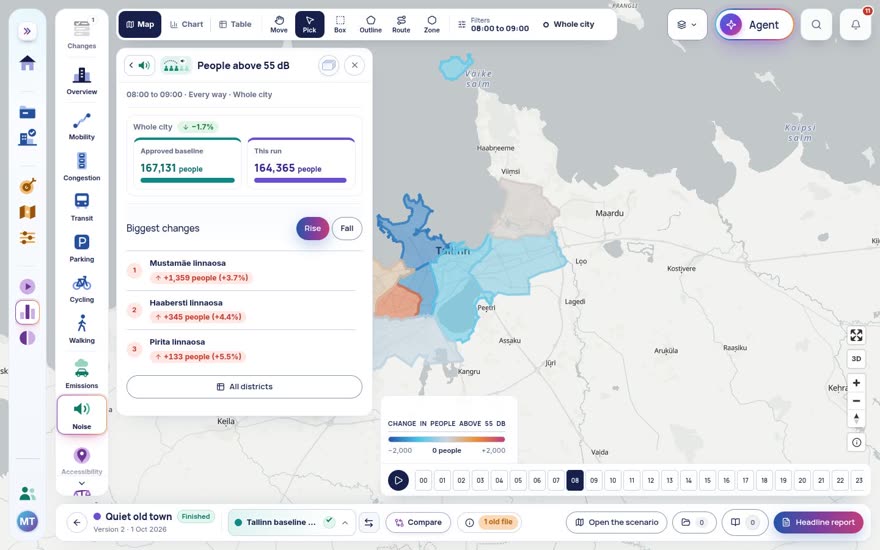
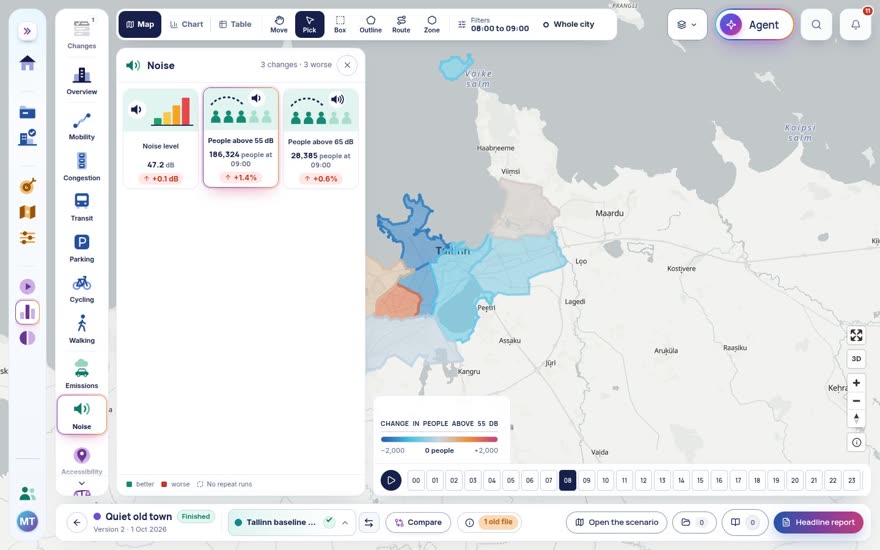
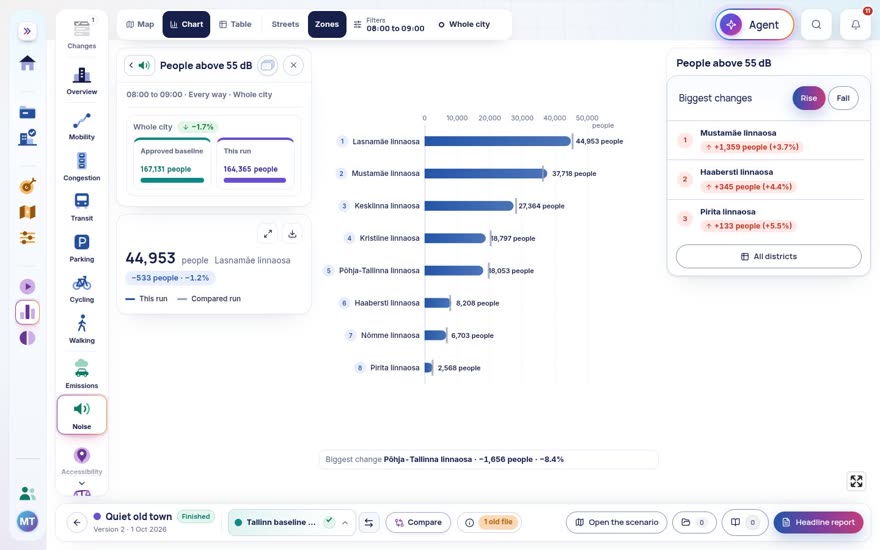
Measure how loud traffic makes each street, by day and by night.
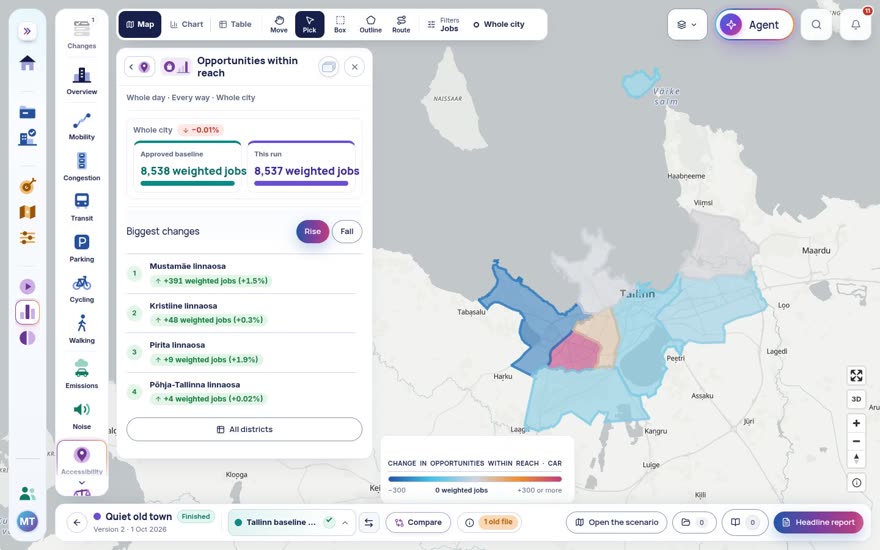
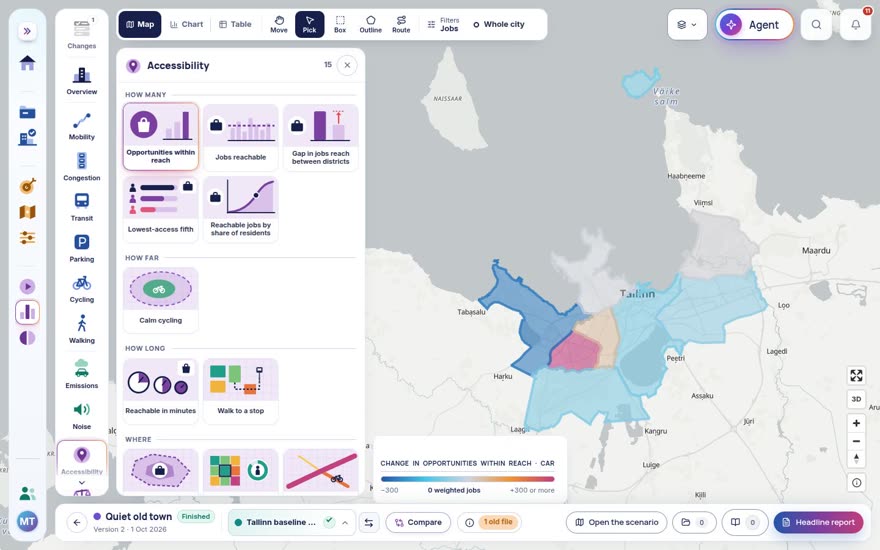
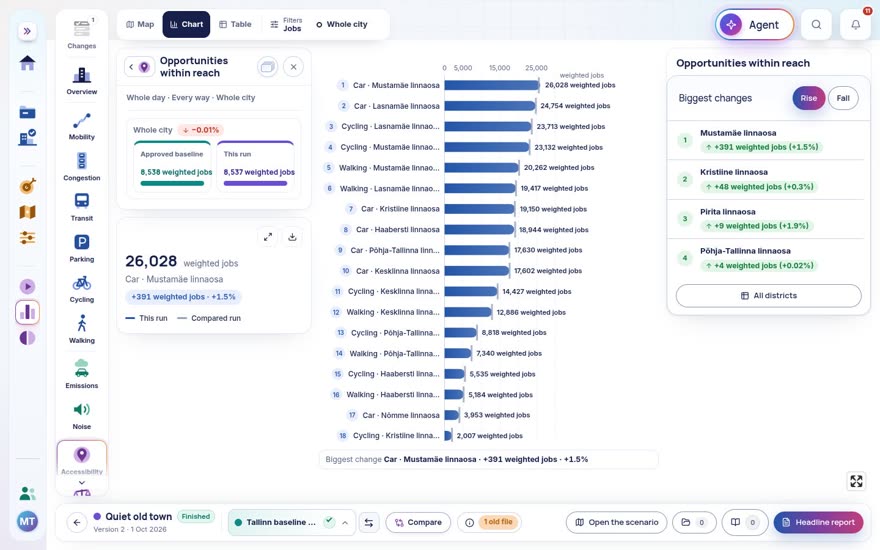
See how easily each district reaches jobs and everyday places, and how that changes between scenarios.
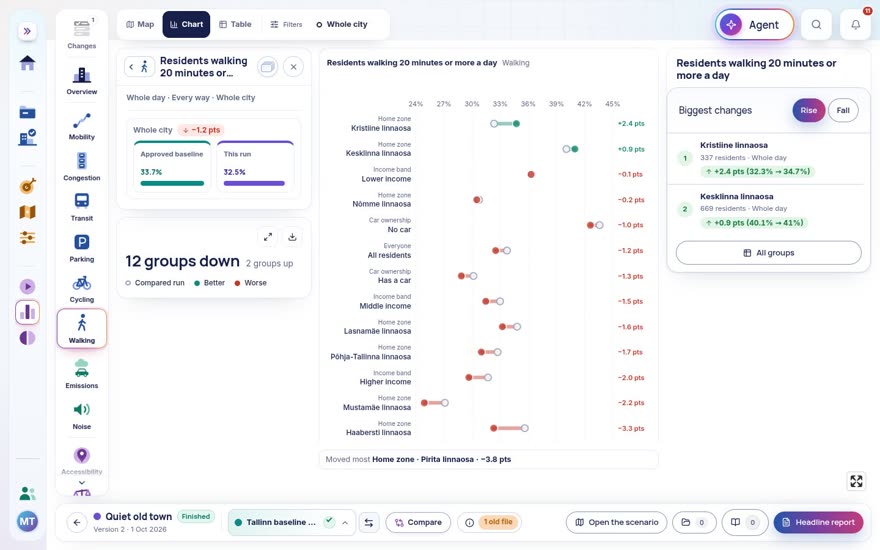
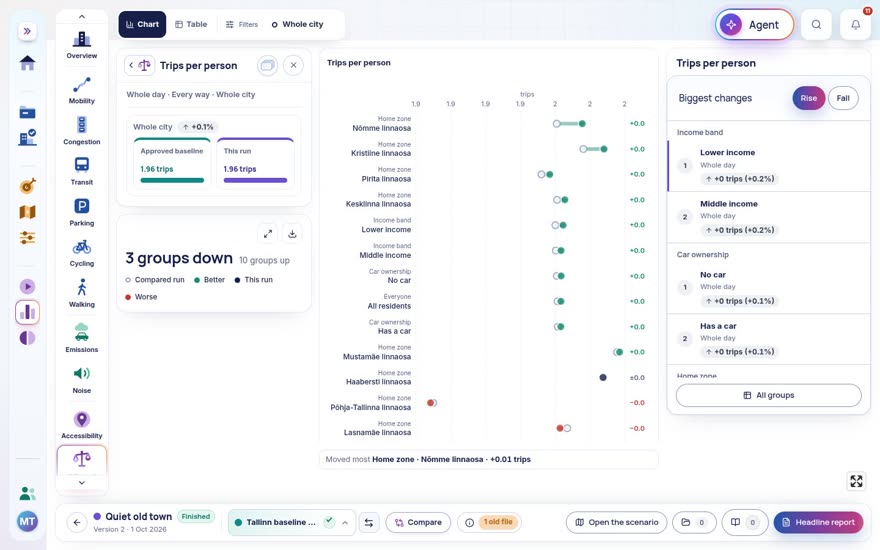
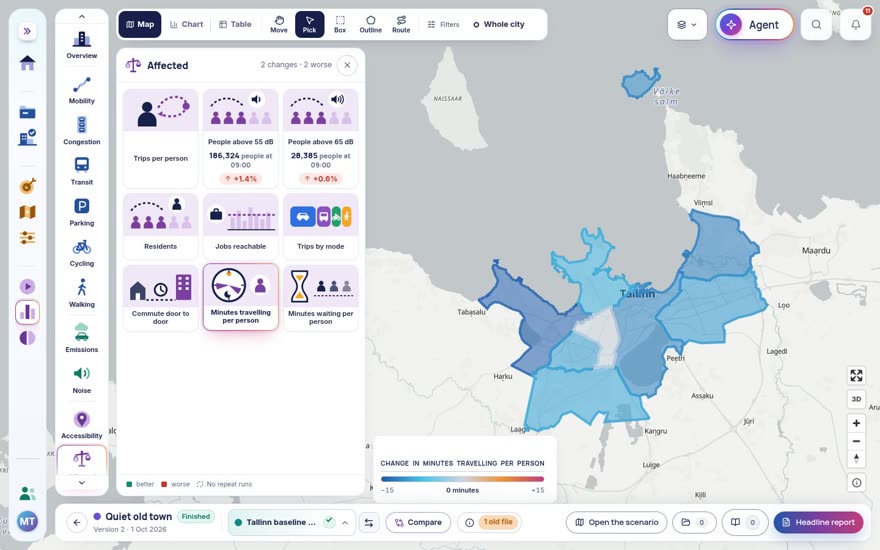
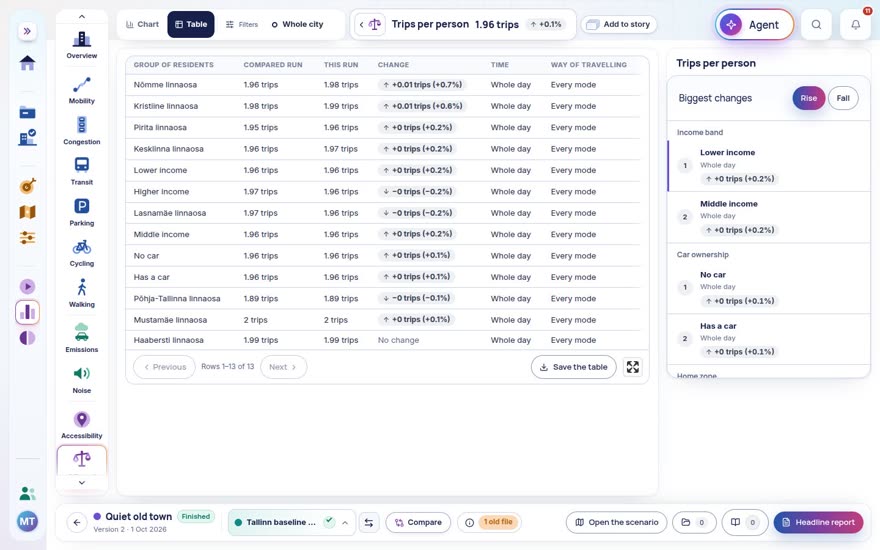
Find who a change helped and who it hurt, and every other effect it has on the city, all from the same simulated day.


09 · COMPARE AND DECIDE
Compare. Decide. Go again.
Same residents, streets and settings, so only the change differs. See where travel moved and who switched.
Go back to any saved version, or start the next one from it.
One run’s results, ready to print for the committee.
- Amsterdam
- Barcelona
- Birmingham
- Brussels
- Budapest
- Copenhagen
- Helsinki
- Kraków
- Lisbon
- Lyon
- Madrid
- Manchester
- Oslo
- Palma
- Paris
- Prague
- Rotterdam and The Hague
- Stockholm
- Toulouse
- Turin
- Vienna
- Vilnius
- Warsaw
- Sofia